고정 헤더 영역

상세 컨텐츠
본문
■ Figure 객체
- figure()를 이용하여 Figure 객체를 얻을 수 있다.
- plot() 함수를 이용하여 그래프를 그리면 자동으로 Figure 객체가 사용된다.
- 여러 개의 윈도우를 동시에 띄워야 하거나 그림의 크기를 설정해야 할 때 주로 사용된다.
| matplotlib.pyplot.figure(num=None, figsize=None, dpi=None, facecolor=None, edgecolor=None, frameon=True, FigureClass=<class 'matplotlib.figure.Figure’>, clear=False, **kwargs) |
| figsize : inch 단위로 그림 크기를 설정. Default size :[6.4, 4.8] |
# Figure 객체를 이용하여 그래프 사이즈 조절

plt.figure(figsize=(10, 3))

x = [1, 3, 5, 8, 12]
y = np.power(x, 3)

plt.plot(x, y, 'go--')
plt.show()

■ subplot()과 subplots()
- 하나의 윈도우 안에 여러 개의 차트를 보여야 할 때 subplot(), subplots()를 이용하여 그래프를 그릴 수 있다.
- subplot()은 부분 그래프를 그릴 때마다 설정, subplots()는 한꺼번에 설정을 한 후에 그림. 부분그래프가 많을 경우 subplot()가 조금 더 효율적
- axes는 Figure 객체 안에 있는 각각의 플롯을 의미
- subplot()을 이용해 명시적으로 axes를 얻어오거나 자동으로 생성해주는 axes를 사용해도 된다.
- subplot()
| matplotlib.pyplot.subplot(*args, **kwargs) |
|
args : nrow, ncols, index를 지정하는 3자리 정수를 이용하여 서브플롯의 위치를 설정
|
- subplots()
| subplots(self, nrows=1, ncols=1, *, sharex=False, sharey=False, squeeze=True, subplot_kw=None, gridspec_kw=None)[source] |
|
nrows, ncols : 정수값으로 서브플롯의 행, 열수 지정
sharex, sharey : 불값(defult : False) x, y 축 사이의 공유제어 속성
|
# subplot()을 이용한 서브플롯의 작성

import numpy as np
import matplotlib.pyplot as plt

t = np.arange(0.0, 2.0, 0.01)
s1 = np.sin(2*np.pi*t)
s2 = np.cos(2*np.pi*t)

plt.subplot(2, 1, 1)
plt.title('Sin / Cos Graph')
plt.plot(t, s1, 'y-')

plt.subplot(2, 1, 2)
plt.xlabel('Time(s)')
plt.plot(t, s2, 'r-')

plt.show()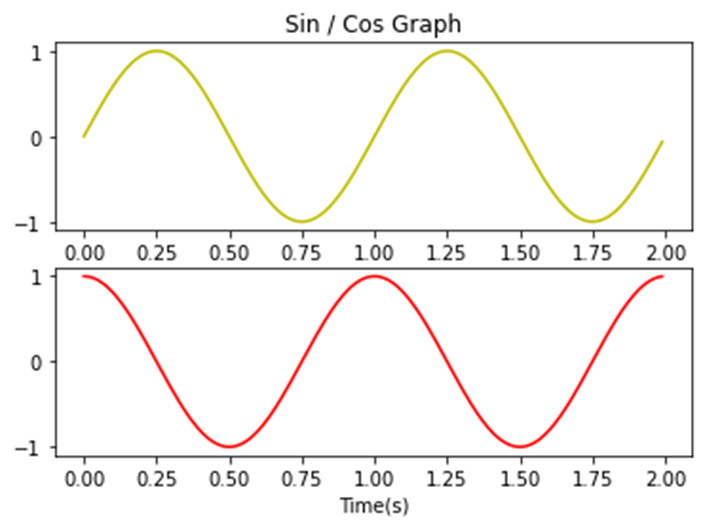
'데이터 분석 > 시각화' 카테고리의 다른 글
| 06. matplotlib - 다양한 차트 (0) | 2023.11.03 |
|---|---|
| 04. matplotlib - 스타일 설정 (2) (0) | 2023.11.02 |
| 03. matplotlib - 스타일 설정 (1) (0) | 2023.11.02 |


댓글 영역